The Basic Workflow of RNA-seq
This note is about learning high-throughput RNA sequencing (RNA-seq), a standard technique for transcript discover and differential gene experession analysis in life science laboratories.
Source of my learning materials comes from the internet. I will list the websites and videos below.
- https://www.bio-rad.com/en-hk/applications-technologies/rna-seq-workflow?ID=Q106ZUWDLBV5
- https://statquest.org/statquest-a-gentle-introduction-to-rna-seq/
- https://www.bilibili.com/video/BV1KJ411p7WN?p=1&vd_source=bd89830c0df367ebc0f22c057e075b53
Experiment Planning
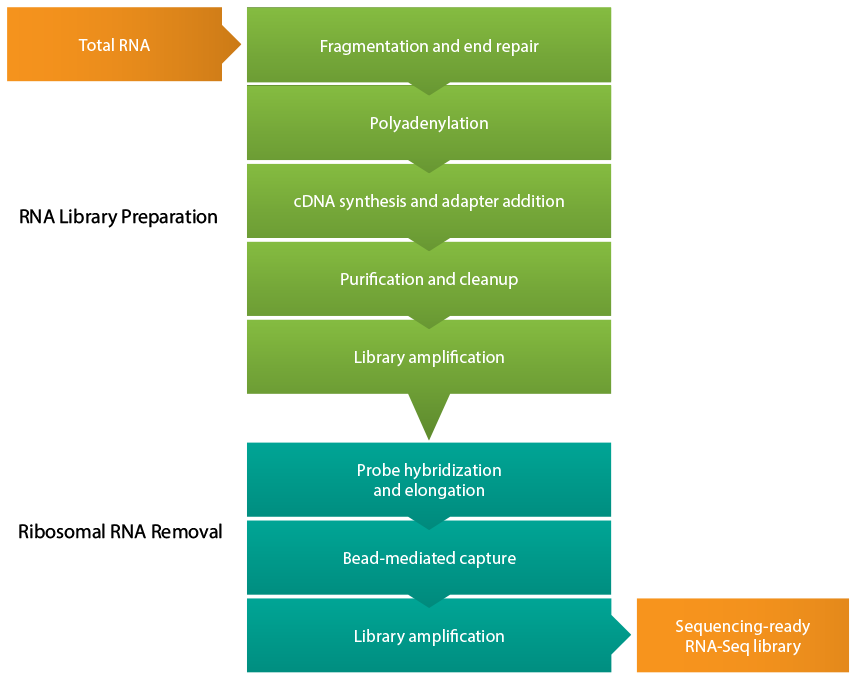
Basic experiment steps include RNA extraction, RNA fragmentation (we have to break the RNAs into fragments because our reads are usually 300bp long in a short read sequencing), cDNA generation, library amplification, and sequencing on an NGS platform to get strings of continuous sequence data in “reads”.
Reference Sequence
Well-annotated genome like the human genome have reference transcipt sequences available for RNA-seq analysis. Otherwise, you might need to assemble the transcipts de novo and then map it onto the transcriptome
RNA-Seq Library Preparation
Special Issues:
- Reverse transcription of RNA into cDNA
- Enrich, purify, and amplify the library prior to sequencing
- Capture all types and sizes of RNA species

RNA Enrichment
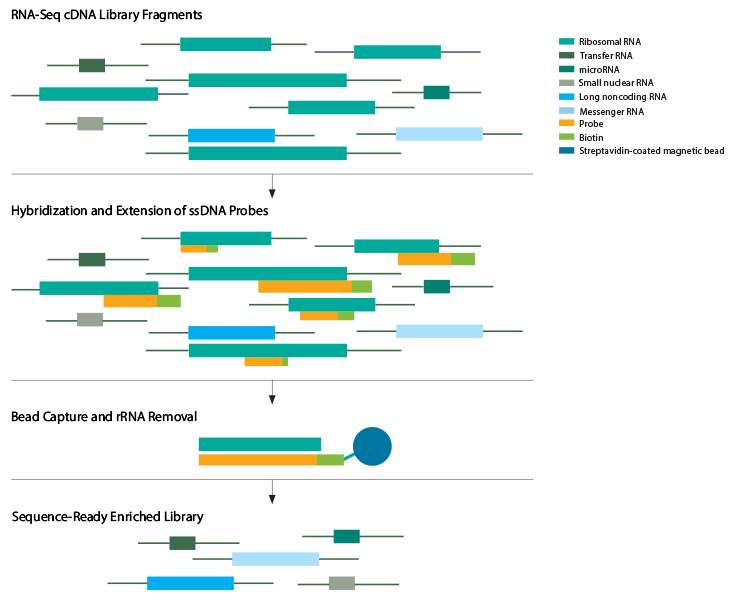
The step of RNA Enrichment is very important because almost 90% of the cell's RNA are the ribosome RNA, and we don't really want them for our sequencing. So we use certain measures to remove them and save the mRNAs or miRNAs (micro RNAs) we are interested in. The two methods used to achieve this in eukaryotic cells are rRNA removal and/or poly(A) selection of mRNA using oligo (dT) primers, which requires high-quality, high-abundance mRNA. Short RNAs like miRNA can be isolated by gel electrophoresis.

Strand Preservation
Basic RNA-seq protocol is non-stranded, and it cannot distinguish the 1st and 2nd strand during cDNA generation, so the you cannot easily find the original mRNA. Stranded (also called directional) RNA-seq first accomplished this by using a modified dUTP nucleotides in place of dTTPs for second-strand cDNA synthesis (Parkhomchuk 2009). This allows for the second strand to be removed by digestion via uracil-N-glycosylase prior to PCR amplification.
RNA-Seq Library Quantitation
The precise quantification of all next-generation sequencing (NGS) libraries is critical use of the NGS platforms. A good library quantitation provides information about the library quality and enables more efficient and consistent loading of libraries for sequencing runs as well as balancing of pooled library samples.
Single-Ended or Pair-End Reading
Single-ended (SE) sequencing reads sequce fragments from only one direction, which may suffice for applications involving well-annotated genomes. But we prefer PE reads, where the fragments are sequenced from both directions. This approach is more costly, but provides the best coverage and is ideal for transcript discovery/quantitation, and identifying splicing junctions (Katz 2010). Long-read sequencing technologies can be used with PE reads to improve the specificity of mapping coding and long non-coding RNAs (Łabaj 2011).
Depth and Replicates
The optimal (best match) number of reads covering a specific region, or sequencing “depth”, depends on the purpose of the study. In general, deeper sequencing provides better quantification, especially for low-abundance transcripts (Mortazavi 2008). However, the extra coverage in deep sequencing may also amplify noise or off-target reads (Tarazona 2011). The number of experimental replicates in an RNA-seq experiment depend on the inherent variability in the sequencing methodology or the biological system being used. In a gene expression profiling study it is critical that any measured differences in abundance are statistically significant.
RNA Sequence Analysis
Common analysis process involves quality control, read alignment (mapping) with or without a reference genome, and other steps for transcript identification, transcript counting, and functional annotation.
In general, there are three steps to the bioinformatics analysis: primary, secondary, and tertiary analysis.
Primary analysis is performed on the sequencer itself. For example, Illumina sequencing technology uses cluster generation and sequencing by synthesis chemistry to sequence millions or billions of clusters on a single flow cell, depending on the specific sequencing instrument. During sequencing itself, for each cluster, base calls are made and stored for every cycle of sequencing by software on the instrument. The base call data, which includes the confidence or quality of each base are stored in the form of individual base call (or BCL) files. When the sequencing is completed, the base calls in the BCL files are automatically converted into sequence data. This process is called BCL to FASTQ conversion.
Secondary analysis takes these FASTQ files to either perform an alignment (using a reference genome) or a de novo assembly (without a reference genome). For model organisms, where reference genomes are available, researcher can map individual reads from the FASTQ files to a reference. There are variety of sequence alignment tools available online.
Transcript Mapping
Mapping the reads to a reference sequence to identify and quantitate the expressed genes.
Reference-Free Mapping
De novo construction is performed when the reference genome is incomplete or one does not exist. In this scenario, an assembly is constructed: short reads are assembled into larger contigs based on areas of sequence overlap, from which a full-length reference transcript is created for mapping. In order to generate adequate coverage for this purpose, PE strand-specific and long-read RNA-seq is preferred to short-read technologies. The software tools for this application include SOAPdenovo-Trans (Xie 2014), Oases (Schulz 2012), Trans-ABySS (Grabherr 2011) or Trinity (Haas 2013). While do novo assembly allows gene analysis from any system, it is less amenable to low-abundance transcripts or genes with complex splicing patterns (Au 2013; Steijger 2013).
I don't really understand the next part, so I will leave it copied from the website.
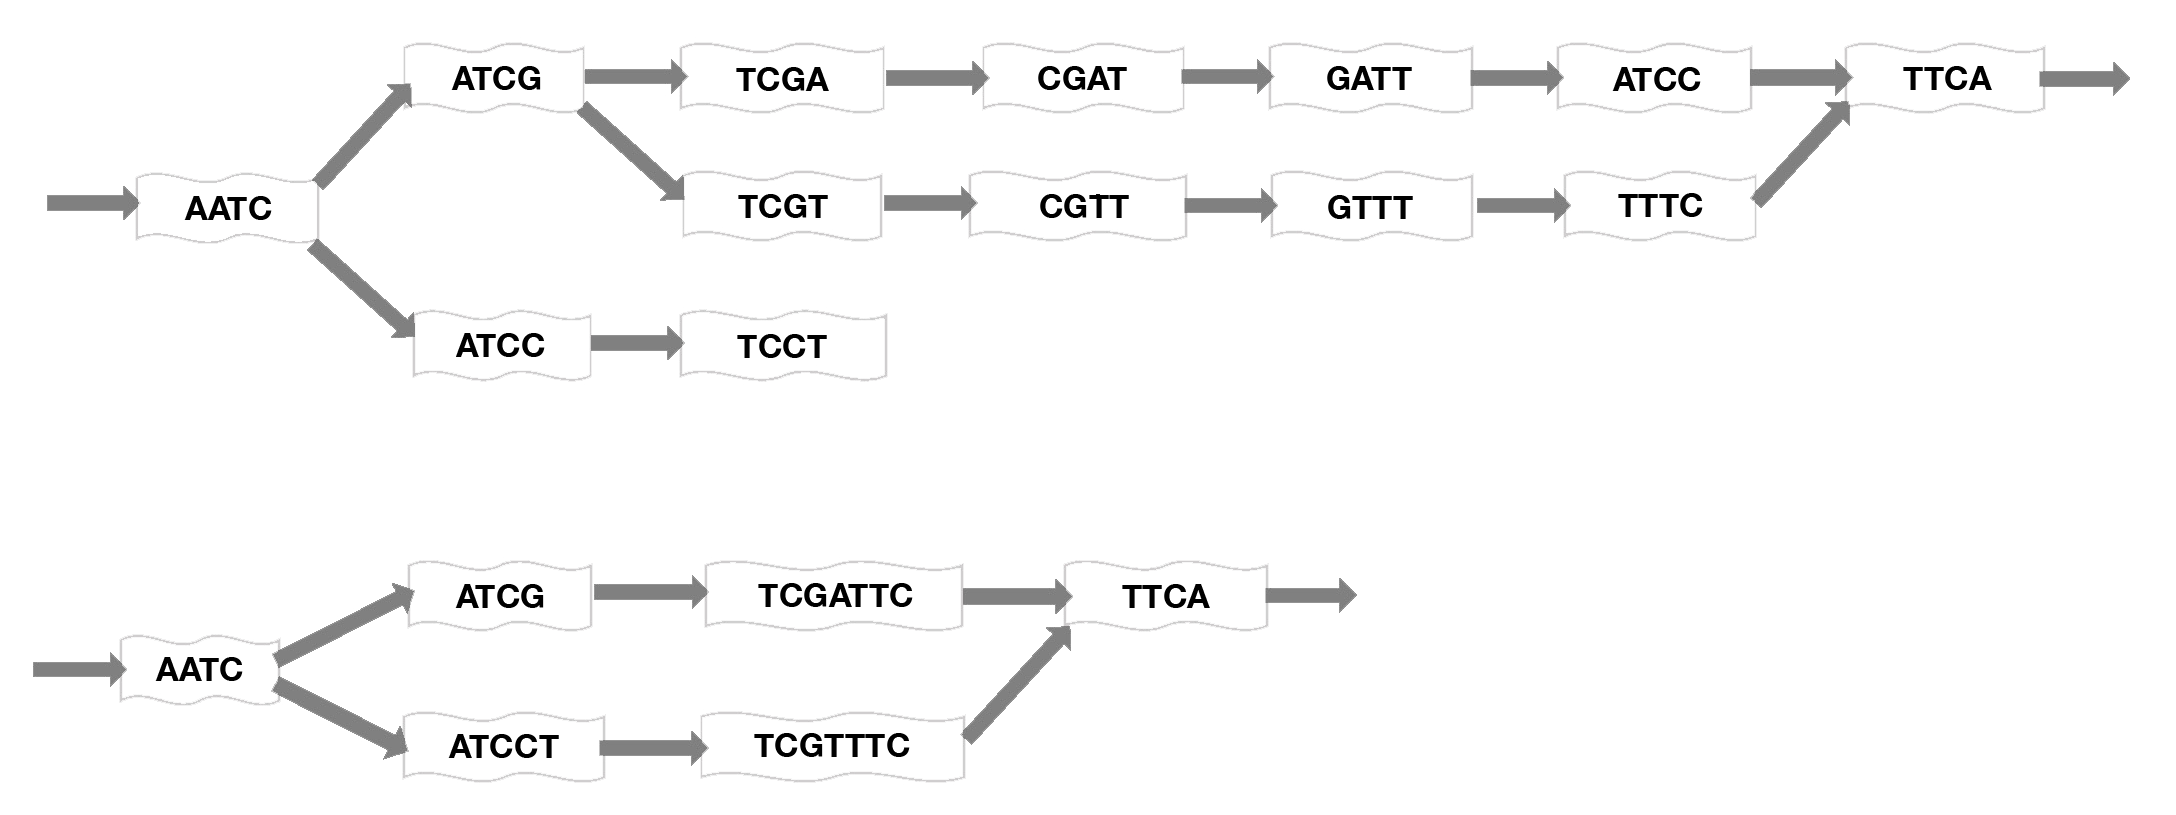
Assembly of millions of short sequencing reads into contigs is computationally difficult and requires addressing problems such as sequencing errors, coverage gaps, and the presence of splicing variants. One of two general approaches or algorithms are employed for assembly: overlap graphs and de Bruijn graphs. Early assemblers used pairwise overlaps between reads to extend contigs. These contigs are connected to create the reference. However, this approach is not practical when dealing with hundreds of millions of reads. Therefore, de novo transcriptome asssemblers use De Bruijn graphs, which are constructed and extended based upon k-mers, using a shorter subset of a read, where k is the length of the subsequence. A set of k-mers in a species’ genome, in a genomic region, or in a class of sequences can be used as a signature of the underlying sequence. This makes the assembly process less computationally intensive. Most secondary analysis assembly tools use this De Bruijn graph method (Lin 2016; Chaisson 2008).

Mapping short reads onto a De Bruin graph. Short sequence subsets, or k-mers, are assembled into contigs using an algorithm that considers each k-mer as a node on a graph then optimizes the graph by connecting edges at overlapping sequences and merging nonbranching paths to a single node to generate the shortest path length. Here, k=4 for example, but much longer sequences would normally be used. Top: initial graphing of sequences onto the map. Bottom: compacted graph produced by merging nodes (adapted from Limasset 2016).
RNA-seq Data Quality Checks
After the data is mapped, we have to perform quality checks using tools like FASTQC. The purpose of quality control checks of raw reads is to detect PCR bias, contamination, sequencing errors, and other artifacts. These quality checks look for GC content, adapters, number of reads/fragments (k-mers), and duplicate reads. Further, read quality drops towards the 3’ end and can affect transcript mapping. After you find the low quality data, you can remove them using Trimmomatic
Below are the things I don't really understand, and needs to pay a lot some attention to.
The percentage of mapped reads (to a reference genome or transcriptome) is also an indicator of sequencing accuracy. A high percentage of mapped reads is expected when a well-annotated genome is available. Conversely, a low percentage can indicate RNA contamination from rRNA or non-coding RNAs. Software packages like NOISeq (Tarazona 2015) or EDASeq (Risso 2011) can be used for such analyses.
The GC content and clustering of mapped reads close to the 3’ end of poly(A)-enriched samples are important indicators of PCR bias and overall RNA quality, respectively. Tools like Picard, RSeQC and Qualimap are useful in quality checks during mapping. Finally, statistical analysis of replicate experiments should indicate a Spearman R2 value which is > 0.9 (Mortazavi 2008). In cases where biological heterogeneity is expected, other forms of statistical analysis are recommended.
Specific Applications
Differential Gene Expression Analysis
One of the most common uses of RNA-seq is to determine how gene expression changes in response to disease pathologies, therapeutic intervention, or other stimuli. Differential gene expression (DGE) analysis compares different experimental samples and uses toolkits to evaluate if the observed difference between normalized read counts of a gene is statistically significant (Dündar 2015). DGE is performed following the initial alignment, quantitation and normalization steps, and has two main goals:
- Assessing the magnitude of the difference.
- Assessing the significance of the difference.
Popular tools in this space are edgeR (Robinson 2010), DESeq2 (Anders and Huber, 2010; Love 2014), and limma-voom (Ritchie 2015).
Small RNAs
Small RNAs are a class of non-coding regulatory RNAs that are characterized by lengths shorter than 200 nucleotides. This class includes miRNAs, short-interfering RNAs (siRNAs), and Piwi-interacting RNAs (piRNAs), amongst others. The sequencing strategy for these RNAs are different because most are between 18 and 30 nucleotides. In a standard small RNA-seq experiment, all reads are aligned to a reference genome using tools like Bowtie2 (Langmead 2012), STAR (Dobin 2013), or Burrows-Wheeler Aligner (Li 2009), or aligners like PatMaN (Prüfer 2008) and MicroRazerS (Emde 2010). Contamination from degraded mRNA can skew read data, so it is critical to check for reads that map to high-abundance housekeeping genes.
Alternative Splicing
Differential splicing of mRNA leads to different protein products from a single gene. Many diseases, including cancer have been linked to splicing misregulation, which is why RNA-seq is routinely used to study this phenomena. Alternate splicing is difficult to study using standard short-read RNA-seq; however numerous algorithms are available. The two DGE methods used to analyze alternate splicing are isoform-based (cuffdiff2 and DiffSplice) or count-based, which includes exon-based (DEXSeq, edgeR, JunctionSeq and limma) and event-based (dSpliceType, MAJIQ, rMATS and SUPPA/SUPPA2). Isoform-based methods use sequencing reads to construct the full transcript and measure abundance prior to differential expression analysis (Trapnell 2013; Hu 2013). Count-based methods count different features to determine percentage spliced, exons, and junctions (Anders 2012; Robinson 2010; Hartley 2016; Ritchie 2015; Zhu 2015; Vaquero-Garcia 2016; Shen 2014; Alamancos 2015; Trincado 2018).
Conclusions
RNA-seq has revolutionized the transcriptomics field and new computational tools continue to help tackle the bottlenecks in data analysis and downstream modeling. Single-cell analysis and long-read RNA sequencing are two areas that are quickly evolving, with future developments expected to address limitations with low-abundance starting RNA and constructing long transcripts.
Extra
Single-Cell RNA-Seq
Single-cell RNA-seq (scRNA-seq) is an emerging technology that reveals the unique gene expression signature of individual cells, which is otherwise lost in bulk studies. These experiments are inherently different from bulk RNA-seq and employ unique workflows and analysis strategies. A common practice in scRNA-seq is the use of spike-in molecules, like the External RNA Control Consortium (ERCC), as an internal control. The number of molecules corresponding to the spike-in is then used to normalize RNA abundance across all single cells. Unique molecular identifiers (UMIs) may also be included to barcode the molecules of interest as a way to control for PCR bias. One of the main challenges with scRNA-seq continues to be the limits on sequencing depth. Some computational tools for scRNA-seq are single-cell normalization (Brennecke 2014), Monocle (Trapnell 2014), and scLVM (Buettner 2015).
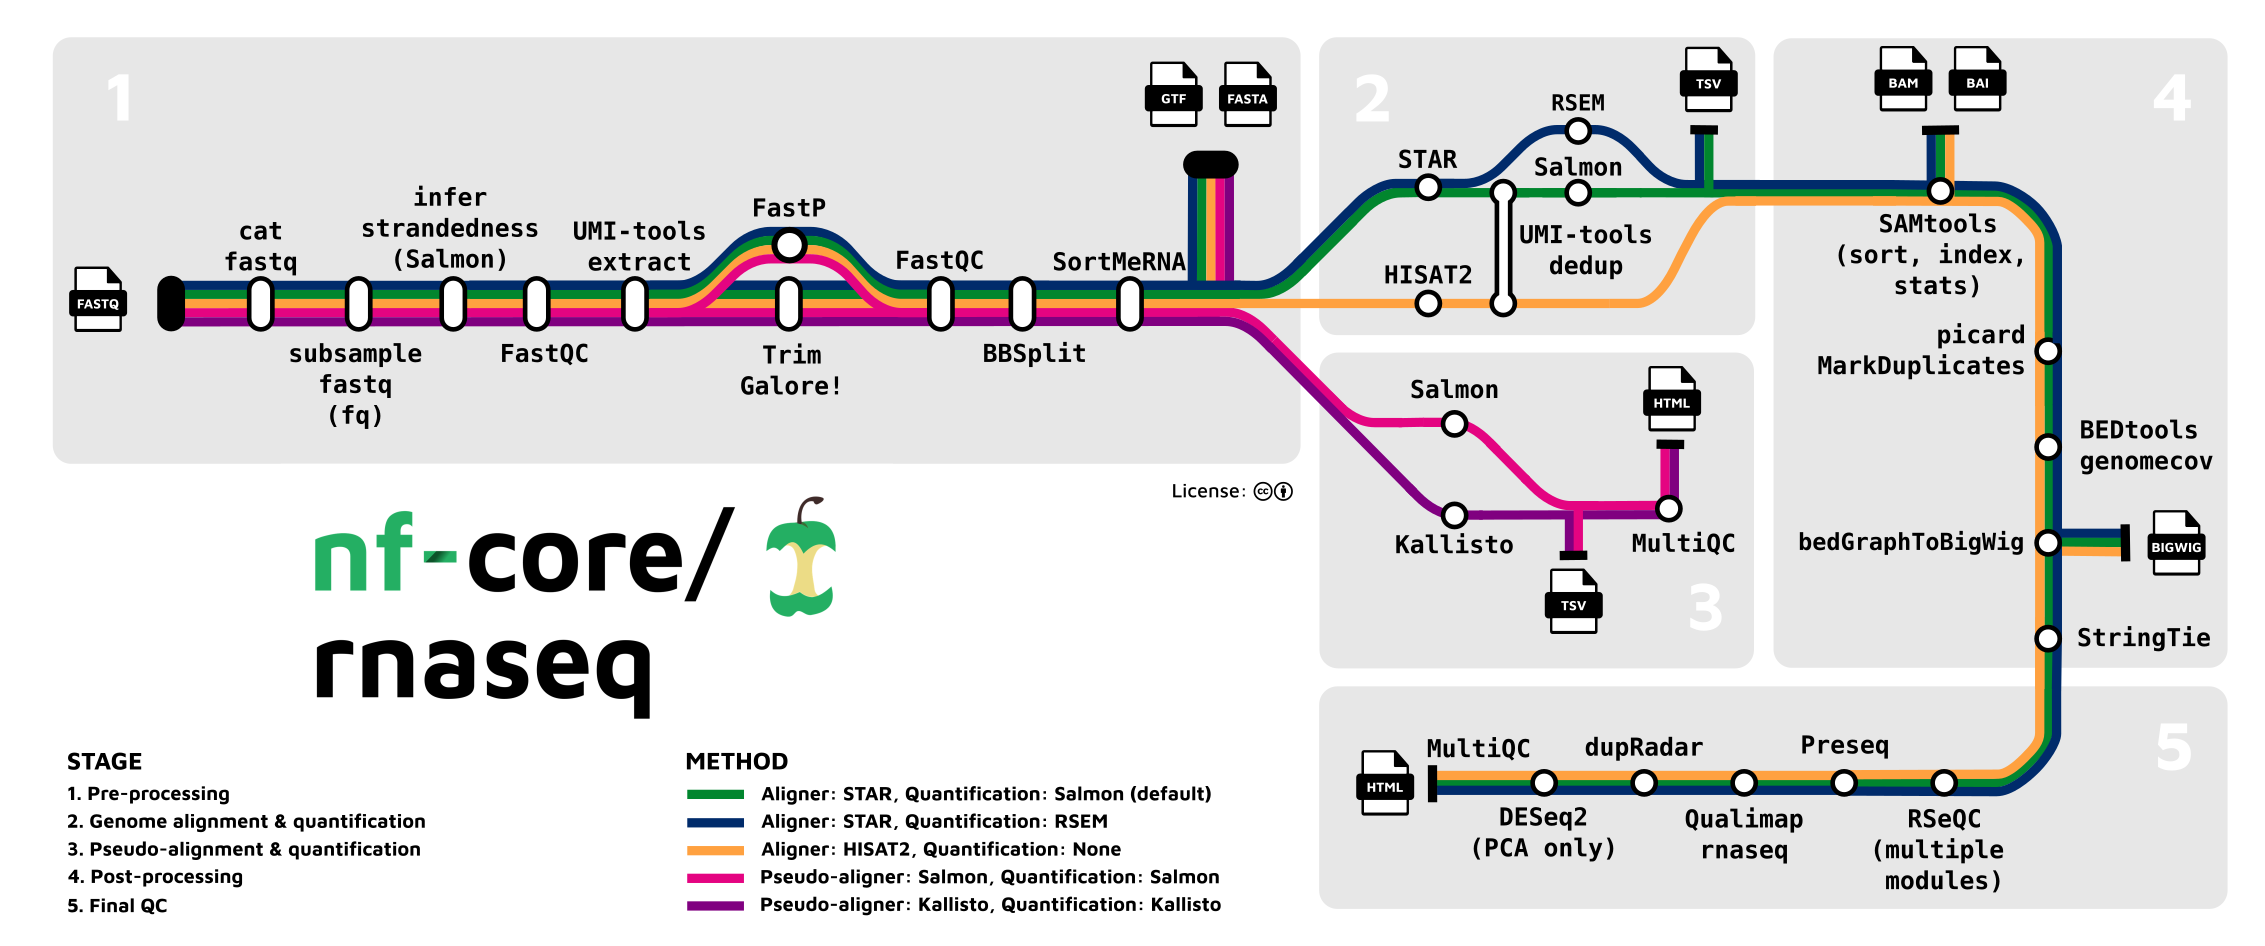
A Workflow Map
